A theory of presentation and its implications for the design of online technical documentation
©1997 Detlev Fischer, Coventry University, VIDe (Visual and Information Design) centre
The practical work that accompanied the development of the theory of presentation involved the design and prototype implementation of a on-line document, the cinegram (cf. appendix I–Cinegram). This chapter therefore concentrates on document system design, although it will be clear that I take design to include more than that. So far the study has shown how presentation remembers documents and other available resources, i.e., how it turns them into members of the current focus through navigation and articulation. Now I want to reverse this perspective and to discuss how document design decisions predict presentation.
Design predicts emergent presentationit treats it as probable schedule. In the light of such prediction document system design makes availability decisions. To optimise availability becomes a problem particularly when the overall resource pool is large, complex, and subject to frequent changes.
Users' designs and presentation strategies can become an important source for authorised design. They show how users secure availability of critically important resources through combination, location and cueing choices which are also common in authorised design.
Users' design extends to meta-navigation as it suggests new resource types, and meta-articulation as it repairs presentation through (self)–correction and the navigable resource through re-filing or customisation.
Users' design is grounded in immediate needs which define the resource and its points of entry. The designer is more removed from such needs. This difference also shows in the scope of the resulting resource. While users' resource is designed ad hoc and has a small group of users, the authorised resource is often expected to work not just for the organisation, but for its market composed of existing and potential customers.
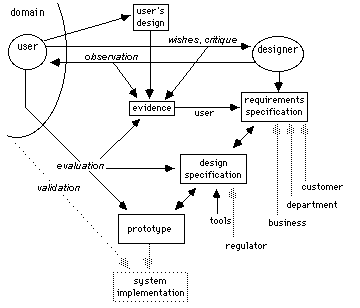
The process of design can be understood as a presentation between the designer, the domain, the target setting, and the people involved in the design process. Triggered by a commission, the product cycle, or (in my case) by a research project, this presentation recursively generates articulations and transformations that produce evidence, for example, users' design, annotations and wish lists, interview transcripts and evaluation reports, brainstorming results, field notes, sketches, memos and prototypes (cf. figure 8.1).
Figure 8.1. Overview of the design process. The greyed-out areas show aspects that were not or only partly addressed in the cinegram design.
The problem driving this design presentation is however not that of the designer, but that of the client and its users. The situation becomes more complex as differences appear between what the client thinks is the problem, and what the users want and complain about. Other perspectives that appear are those of the client's customers, individual departments, and the regulator. This study is biased towards the user perspective because of its grounding in users' presentations in the field and in the cinegram evaluations. However, the grounding implies that the other perspectives are indirectly presented because they influence users' presentation in many ways.
The designer is an intermediary between these different perspectives. Defining the problem turns out to be rather complex task since every perspective contributes requirements which are often in conflict and seem to have no common design solution [1]. Also, while the user has a precise idea what his or her situated problem is and what transformation would solve it, the designer will ask why this problem exist in the first place. Are there perhaps more fundamental problems which need solving or are already being solved (or turned irrelevant) by changes of context, and how will this context affect users' problems? Here design becomes business process re-engineering, which like more modest design projects has the problem of having to predict the outcome of its interventions [2]. For example, as this thesis is being written, Rolls Royce's move towards projectisation will dissolve the service engineering section and append individual experts to the different engine projects. The impact of this transformation will change a large part of individual's resource infrastructure.
Design has different authors (authorising change) and happens on different levels of abstraction. The design of documents and document systems is, in this view, but a small subset of the total sum of design activity in an organisation, and must be seen in the context of business process design, setting design and job definitions. I will take up this point in chapter 9–Conclusion.
After an overview of different perspectives and their requirements, I will concentrate on user requirements since they are directly related to users' presentation. This happens in recognition that in the field of aircraft manufacturing and operation, the other perspectives, particularly standards and regulations, strongly influence documentation design.
Presentation flips over into requirement at the point where needs are not resolved and saturated, but remain presentations in waiting. The unavailable resource is then not the medium of presentation, but subject to a meta-presentation specifying some resource that would improve substantive presentation. Such specification happens implicitly in every critique of existing resources, and explicitly wherever frustrated needs spark talking about desirable resources or lead to actual transformations in user design.
Designers are typically a step further removed from users' meta-presentation of requirements. They negotiate different and often conflicting requirements of several perspectives and transform them into a design specification. The following section indicates a range of typical requirements; it does not spell out particular requirements for the cinegram, although the cinegram design process frequently serves as an example.
User requirements often suggest resources which differ from what is offered by internal or external service providers. Importantly, they indicate a preference for pleasing rather than merely efficient resources (cf. section Navigation pleasure in chapter 6–Navigation). The user articulates his or her needs in three ways: deliberately, as articulation of requirements/wishes; as critique of existing resources, explicitly or implicitly (for example, by avoiding use), and in the design of informal resources.
Users' articulate requirements for new resources. Articulated requirements may address certain features in known resource types, or aim at new resource types. The former are articulated, for example, in service engineering's wish lists for the Trent engine, or in comments or wishes of prospective user's on ETG drafts (cf. appendix III–Engineering Technical Graphics). Requirements for new resource types are blueprints which may or may not lead to design. An example is engineers' wish for a system ‘where people like us can load their experience into it…it should be done on the basis of frequency’[3] [FN 4-5/7/95 P47].
The designer can prompt such articulations. As shown in chapter 5–Articulation, such prompting can distort the resulting evidence by instantiating a form which leads to projective binding of requirements to the problem implied in the prompting trigger. For example, I opened a session with service engineers by asking them to think of possibly useful features of an interactive system based on ETGs and system diagrams. This might have bound to some extent users' articulation of desirable features. However, emergent sessions tend to dissolve such projective binding. During the brainstorming, service engineers articulated many requirements which clearly transcend the projected topic ‘interactive ETG’they named direct access; integration within systems and between systems (including technical manuals); visualisation of dynamics and state changes; and indicated concerns about display validity (cf. appendix IV–Brainstorming summary).
Users' critique may be explicit or implicit. Explicit critique of resources has formal channels such as manual revision requests, but the weight of standards and the distance between users and the design process make critique rare in other than informal settings. For example, engineers informally complained about excessive cross-referencing; non-intuitive task numbering; crowded illustrations; difficulty of matching IPC parts to figure numbers; incorrect details (e.g., pipes not shown at the right place); and redundant details (e.g., views of every pipe clipping) [4] (cf. appendix II–ATA-specified documents). An implicit critique of resources lies in non-use or rare use. Most service engineers, for example, said that they rarely use the CD-based electronic Engine Manual system DRUID.
User-designed resources develop from situated knowledge of the domain's processes. They are informal information systems which settle in the interstices of existing systems [5]. Some resources fill the gap where existing systems fail to meet requirements. For example, service engineers' at Rolls Royce create local Excel databases which allow entry of circumstantial aspects of engine faults that are not accepted by the tight format of the mainframe engine history database, SERAPH.
Other user-designed resources reduce navigation distance. An example is line mechanics' reference card for checking tyre pressures on a range of serviced aircraft, covering all expected reference instances [6]. This illegitimate but useful type of resource is nowhere found in the generic object-focused aircraft documentation.
The design of resources intends to save time but also costs time and effort. Some engineers use their own time (even lunch breaks) to design missing resources. For example, one engineer programmed a simple application for international time conversion. The cost of such user design seems often offset by social reward. Users' design activity is a respite from work proper, pleasurable, and rewarding: the user-as-designer is popular since the resource helps others, too.
The price of users' design is the limitation of scope and integrity of the resulting resource. Its content is unavailable for all but a single user or a small group. There is a likelihood of duplication and inconsistency between resources, a lack of updating regimes, and usability problems for newcomers.
There are several other perspectives contributing requirements for design: that of the organisation, the department, the customer, and the regulator [7]. The organisation's business requirements suggest the adoption of resources of the same quality and to the same technological standard as those used by competitors. Decisions about the design, production, distribution and maintenance of documentation are not only influenced by capital costs, but also by perceived customer expectations, technology available to the organisation and its customers, competitors' actions, anticipated business opportunities, and regulatory requirements. Costing different models is difficult because of the price dynamics of external services, hardware, resource carriers, communication cost, distribution cost, required training, etc. I can only scratch the surface here; interested readers may look at Lindsay's (1994) writings on the information economy [8].
There are departmental requirements which may defend existing systems against attempts of generic re-design by IT departments [9].
There are customer requirements concerned with adopting dominant technological standards, streamlining business processes, reducing the cost of documentation [10], and improving usability. According to operators the main problem is the multiplicity of resources, e.g., the split between the Maintenance Manual and more recent documents such as Temporary Revisions, Service Bulletins, Engineering Orders and Repair Schemes. This implies increased effort invested in navigation, comparison, and updating.
The regulator 's requirements demand adherence of documentation to strict protocols such as specifications, standards, and certification regimes. These protocols are expressed in specifications such as ATA100 and ATA2100 [11], AECMA, or IETM [12]. It is therefore more difficult than in other areas to apply lessons from informal user design. The ‘ideal process’ of regulation, quality control etc. is also much too slow to keep pace with equipment development and changes. Work outsourced to speed up design adds to the complexity of co-ordination, while frequent temporary revisions add cost and updating complexity.
The designer's position largely determines the relative weight of the aforementioned requirements and the degree to which they shape the design process. Also, designers add their own requirements based on their skills, tools, or predilections. I choose the requirements of authorised design which is tied to the core production process and generates documentation as contractually defined and regulated part of the engineered product, and, at the opposite extreme, my own requirements that mediated research need and domain need.
The authorised designer's requirements are shaped by cost/effort estimations, the weight of existing skills, techniques and design methods such as the ‘ideal process’ of technical publication, the power differential within the organisation (how to avoid being made redundant through outsourcing), and individuals' financial or career rewards and learning opportunities [13].
Stated aims are the streamlining of the design process; catching up with the speed of equipment change; automating document generation or encoding advisory intelligence into systems [14]; versioning and integrity control aided through SGML parsing (so that never again there will be two ‘yes’ arcs leaving a FIM decision box); reducing distribution costs by moving documentation to CD or on-line [15]; improving transformation protocols to allow the use of existing engineering data rather than retracing them for illustrations; or basing documentation on 3-dimensional interactive engine models.
Author's requirements. The current author's requirements mediated research needs and domain needs. The academic requirements, i.e., those of the academic business, research regulations, and the academic audience, were in conflict with the requirements that emerged through the field work at Rolls Royce. This is not a matter of choice but part of the design context. That the cinegram design was embedded in an academic context meant that it was not constrained by the engrained design traditions and social and regulatory protocols I observed at Rolls Royce. Instead, the academic validation context rewards noveltynot reliability, cost effectiveness, or adherence to standards.
The requirements began to mesh as the change of research direction towards an empirical investigation of a domain implied that addressing (if not satisfying) the domain need would be one condition for satisfying the research need (amongst other conditions, such as novelty, philosophical level of argument, defensible research strategy and methods, etc.).
The conflict of requirements is apparent in the gap between the regulator's requirements setting out how things are supposed to be done, and the user's requirements based on the way things are actually done. The conflict creates presentation artefacts that paper over the gap. An extreme of such papering-over is the reverse side of presentation: hiding. In the domain of aircraft maintenance, hiding [16] of informal activity is motivated by the constantly looming threat of post-mortem liability claims following incidents and accidents. The threat is countered by the construction of presentable evidence of recorded procedure, i.e., certified and up-to-date formal documentation, and the construction of the myth that work always adheres to documented procedure. Stage sheets underpin this claim by concatenating the relevant bits of the ATA documentation into the official and complete schedule of every maintenance task [17]. The problem is that checking each action against a documented procedure is redundant, disruptive and time-consuming and therefore often avoided, though no one would want to admit it except for trivial tasks with no safety implication [18]. However, in rare cases, sticking to the procedure may prompt actions which, had they been omitted, would risk lives. This is linked to visibility. The analysis of factors contributing to the incident of the A320 KMAM at Gatwick on 26 August 1993 showed that the unavailability of collars specified in the maintenance procedure to support wing spoilers contributed to the forgetting of reversing the spoilers from maintenance mode to operating mode. Had collars been visibly in place, they would have reminded staff to reactivate the hydraulics the failure of which led to the dangerous incident. The counterpart of documented procedure, experience, can therefore be dangerous, for example, by affording projection across equipment types that differ in important details [19].
The designer's task is to transform the negotiated set of required referent system dimensions into properties of the document system [20]. This happens on the level of architecture, display, access protocols, pointers, and meta resources such as training, updating and support structures.
A fundamental problem is that no document system can determine the conditions of its use or interpretation. Many documents are used for ends that were not intended by their designers. The success of any particular design transformation depends on successful predictions of patterns of activity. These patterns transparently embody a host of dimensions that are not included in the document, but may be documented elsewhere (such as required spanner loads, the meaning of diagrammatic symbols, etc.).
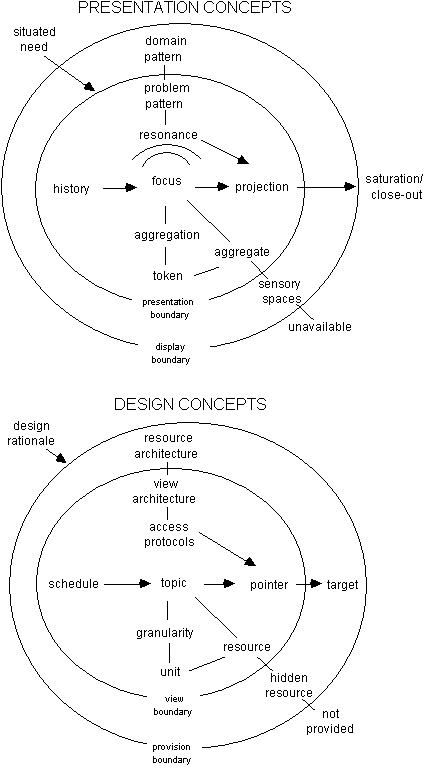
Figure 8.2. Contrasting presentation and design concepts.
Documents are therefore mediated by users' practice which provides situated qualification and often, by other resources [21].
Presentation concepts can be mapped onto design concepts. The relationship is shown in the corresponding two halves of the diagram in figure 8.2.
Design theory usually suggests a flow from the analysis of the problem (articulated as requirements specification) to the synthesis of design (articulated as design specification) [22]. The empirical analysis of domain processes leads to syntheses on various levels: first, the requirements specification, then, the design specification, and finally, the system implementation [23].
The specification draws the boundary od design. It determines what physical bits and events beyond the equipment are taken into account, whether these are scheduled events governed by protocols of, say, maintenance schedules or Air Traffic Control, or emergent events that behave unpredictably or probabilistic like weather or ingested birds. In both cases design predicts known or anticipated processes. It is clear that beyond this prediction there will always be all sorts of situated combinations of possible events.
In the domain of aircraft documentation, much of the supposed flow from analysis to synthesis goes in the opposite direction. Design specifications are constrained by industry-wide standards and driven by the momentum of technological development. These determine to a large part organisations' IT design decisions by enforcing that a compliant system will be introduced [24]. In the airline industry, the momentum is behind SGML-encoded on-line documentation designed according to industry-wide standards.
While such standards are clearly important to secure valid and working transformation protocols within the complex web of manufacturers, operators and services, they also hinder the development of user-oriented resources. Also, standardisation is fraught with problems. For example, operators' expectations that SGML-encoding would secure easy integration of documentation from different sources have turned sour [25].
Resource optimisation attempts to predict what should be available for users in the setting. Resource availability presupposes the resource itself (‘it exists’), cueing the existence of the resource (‘knowing it exists’) and protocols instilled through experience or training (‘knowing what to do with it’).
Prediction of use for the optimisation of resources is usually bound to a specific domain of use. For example, according to prediction the troubleshooter needs visibility of every functionally relevant part of the system and visualisation of internal oil flow while the line maintenance mechanic needs visibility of the engine topography and set procedures in order to locate, get to, remove and install equipment.
Different domains have different repertoires of potentially process-relevant reference dimensions. The repertoire which then enters presentation is a problem-specific subset and often transcends any single unit of resource: the ‘complete’ repertoire for this meeting, case, or reporting task is unlikely to be provided by one document system.
Domain-specific resource optimisation concentrates content visibility for noticing and selects adjacent resources for direct switching. It thereby increases conditions for confluence within narrow temporal tolerances. ETGs, for example, compress an entire engine subsystem with all functionally relevant detail onto one fold-out diagram.
In systems where volume and real-estate limits force much content into the hidden, optimisation of points of entry and of the visibility afforded by the resource midpoint are crucial.
Document system design (or for brevity, system design) means decisions in the light of often conflicting requirements. These decisions draw and negotiate boundaries on all levels. Within the environment, decisions specify the system boundary. Within the system, decisions specify view boundaries. Within views, decisions specify unit boundaries.
This classification which is expanded below is not an attempt to construct an ontology. It is merely a conceptual tool to put some marks on the page which will need qualification. It should not be taken to imply that decisions happen on such neatly separated levels; the opposite is true. The classification simply identifies on a fairly abstract level parameters which system design decisions negotiate in the light of conflicting requirements.
SystemEnvironment. The system boundary separates the system from its environment. The environment is the referent domain and the pool of derivative resources.
(1) One aspect of system boundary is conceptual since it maps onto a boundary drawn within the referent domain which may be conceptual, material, or process-based. It defines the referent system.
(2) A second aspect of system boundary is material since it locates the system in a setting. The system may be whole or segmented; it may be a set of physical objects or appear on-line mediated through an interface.
(3) A third aspect of system boundary is relational and process-oriented since it negotiates the system's position within the overall resource pool, affording cross-document navigation or, in multi-application environments, co-operation. Navigation is expressed in references pointing beyond the system boundary such as (Ref TASK 24-42-00-861-801) which, from within a task covered in chapter 79 of the Maintenance Manual, points to another aircraft system in chapter 24. Depending on the system's implementation this reference may be indirect, i.e. require fetching another file, or direct if the referent document is available on-line.
ViewSystem. The next level of decision concerns boundaries within the system which make up its architecture. The referent system boundary, the density of content dimensions, and the resolution and real estate of the view determine the content which must be distributed to individual views (pages, screens, etc.) within the document (cf. chapter 5–Articulation). This implies segmentation and combination decisions. These tend to follow internal boundaries of the referent system (again conceptual, material, or process-oriented) while being constrained by capacity thresholds of the container. Beyond a small number of views which may simply be pooled, the order of an architecture is needed to organise views within the system. Such order may be conceptual, thereby reflecting decision trees or part-whole, object-attribute, and family relationships. Or it may be temporal and accumulative, reflecting the order of a procedure, history or argument.
Any chosen architecture leads to a hierarchy of navigation distance between units.
(1) Most privileged are the units present on the same view. To these I return when discussing the relation units-views further down.
(2) Next come units on adjacent views which can be reached directly [26] in one step by following simple generic pointers between pages or views such as ‘go next’, ‘go previous’, or ‘go up’ (to the midpoint view or contents page). These may be implicit in the operational protocol, for example, in page-turning, or explicit as on-line button carrying generic instructions.
(3) Last come other units anywhere in the same system which can be reached through pointers carrying some arbitrary address. Examples of such pointers are task references such as (Ref AMM TASK 79-32-11-000-801) which link between different places in the same ATA chapter of the Maintenance Manual, or on-line buttons carrying specific target addresses.
UnitView. The third level of decision concerns the design of views. Here, boundaries to be negotiated are, for example, those between available and unavailable dimensions of the referent object, or those between different perspectives. An ATA classification perspective separates components in other ways than functional of process perspectives. For example, it separates a differential pressure switch from the filter it monitors, while in a functional perspective both components would be shown on one view to afford the understanding of functional interdependencies. Then there are medium type boundaries, for example, in diagrams or composite nodes [27], and unit type differentiation.
Design mediates its decisions across a range of views and levels. Problems are covered in the direction from general to specific.
The document system interacts with aspects of its environment such as users' knowledge and skills, which themselves depend on meta-resources and the history of individual and collective experience and training. The environment is already in place and interacts with a new system.
Beyond affording or precluding confluence in particular presentations, the placing of the system in the environment affects the degree of peripheral learning [28]. Eccentric placing makes it more vulnerable to gaps in operational protocols since there is no peer in earshot who could scaffold use in the learning phase.
Where the system boundary is drawn depends on the scope of authorised design activity and the extent to which it includes the environment [29]. For example, the cinegram boundary expressed a narrow scope since it excluded user and system documentation, had no management dimension defining design and updating protocols, and did not interface to other documents or systems in the field. The reverse side of this narrow scope was the positive effect on the workability of the design project, i.e., it permitted a working prototype to be implemented in time for evaluation and recursive design changes. Design projects with wide scope and complex sets of requirements often take long so by the time they have reached maturity they approach irrelevance.
A basic phenomenon of documents is segmentation into discrete viewspage spreads in printed documents, and nodes in on-line systems. Segmentation in on-line document systems is more discrete and affords less context than the segmentation enforced by the container capacity of the printed page [30]. Node adjacency alone does not guarantee context, first, because the source node disappears at the moment of navigation without the directness of the tactile continuity of page-turning, and second, because undetected browsing errors can create misleading context. Since so little is visible of the on-line architecture, it does not easily afford consistent closure and reversibility of navigation.
In order to minimise navigation distance the design of the system architecture attempts to optimise adjacencies between the displayed view and relevant hidden resources. Users' patterns of resource use optimise architecture through the placement of documents in sight or in reach. Formal design methods such as the interaction net [31] take a shortcut to similar adjacency optimisations by drawing links within the repertoire of units which display the importance and frequency of path traversals.
Material adjacency links units in clusters or series, such as adjacent rooms along a corridor, adjacent files on a shelf, components mounted onto the same gearbox face, adjacent manual pages, or adjacent alphabetical entries. Material adjacency is often coupled with alphabetical or numerical adjacency [32]. Near-confluence is afforded easily, since adjacent units resonate as periphery. Also, it needs just one generic step to display the adjacent unit [33].
The access granularity of resources varies in terms of location, portability, bandwidth, and points of entry. There are also important differences regarding the scope for optimisation of access protocols.
The access location may be on users' desk, or, as in the case of the DRUID system, at a separate desk which makes confluence with the repertoire of desk-based resources impossible. Portability means that while some resource locations may be fixed, other resources can be carried to the location of confluent presentation. Access bandwidth means while using some resources may tie up large parts of the resource pool, other resources are more fine-grained so that chances are that no two users will need the same unit of resource at the same time. Point of entry means that resources offer single or multiple points of entry. While some resources impose an access protocol of fixed length, other resources have access protocols which become optimised through patterns building up in frequent use.
An example of a single point of entry and fixed access protocol exists in computerised systems such as Rolls Royce's DRUID system, which requires set sequences of login, system start-up, and entry via the title screen. DRUID wastes many seconds on loading a large image of the company logo. The operational protocol is complex as indicated by blind alleys [34], i.e., there are hypertext pointers to views in other manuals which trigger the appropriate title screen with a new logo, while continuing reveals that the target view sits on another CD-ROM which cannot be inserted on the fly but instead requires starting all over.
Technical manuals have a much better access granularity since there are many points of entry. The large display real estate of the shelves affords quick selection of required engine and manual type. Importantly, files carry shelf position numbers, i.e. they are tied to a stable position within the shelf pattern. The access protocol involves a sequence of selections from the right document system (e.g., Maintenance manual or IPC), the right file according to chapter range, the right chapter according to the spine card, and the three levels of ATA classification down to the wanted subject. Access becomes speedier as the protocol begins to blend in patterns of use. In comparison, electronic access remains painfully slow, with rare leaps through the acquisition of faster technology.
A view is any single designed system display. A view can be a screen, a page, or the visible part of a diagram. The view boundary includes units and excludes other units, necessitating navigation to other views. The view boundary is only a segment of users' overall display, e.g., the work space with its repertoire of resources [35]. In computer-based environments running multiple applications, the system cannot even determine the narrow system display, which might be partly covered by windows of other applications.
Each view contains a repertoire of content and pointer units. As in all map-making since roman street maps, there is nothing disinterested or objective about constructing the reference relationship [36]. The repertoire of units in views that include pictorial and textual content and pointer units may be analysed as notation, visual language, or diagram [37] where the main units are treated as nouns, boundaries or backgrounds as conjunctions, and links or arrows as verbs.
Notationality implies that pictorial views are read in predictable ways. However, while reading a text is usually cumulative and unidirectional, noticing a view starts at any resonating token and works from there in all directions. Consequently, pictorial views are less able to express implicitly temporal order, causal relationships, conditions, or negation.
Within views, the combination and filtering of content dimensions can improve domain-specific visibility. ETGs, for example, manage to combine cross sections, 3-D illustrations, partial sections for different equipment states, colour coding and arrows indicating flow type and direction, short instructions, trunk paths (for example, indicating engine access panels), and a host of numerical details such as part numbers, diameters, scheme references, and pressure thresholds (cf. appendix III–Engineering Technical Graphics). Users' projection in cinegram evaluations expected similar combinations, for example, they wanted the filter mesh size displayed as part of the filter illustration rather than somewhere into the explanatory text.
The combination and rendering of relevant content dimensions in one view increases display confluence through integration. Optimised rendering may afford system-specific integration as in putting all oil system components on one continuous ETG. Or it may afford task-specific integration through annotation of views with all needed properties such as dimensions, ATA references, or part numbers. Or it may afford spatial integration of several layers in cut-away views where transparency is flexibly allocated according to predicted salience. Or it may afford functional integration in the construction of an optimised cross-section out of many partial section views. Finally, it may afford temporal integration as in the animation of component state changes.
A unit on a view can become pointer token on one level of granularity and content token on another level of granularity. For example, in the cinegram a component icon is content in relation to the overview flow diagram, and pointer in relation to hidden component views.
Pointers have a descriptor (which may be iconic) and a target address, such as index entries pointing to a page, ATA references pointing to subjects within sections within chapters, on-line buttons pointing to another document node, URLs pointing to a web page, or elevator buttons pointing to a floor. The problem of pointer design is that its meaning and status is differential within the chosen repertoire of pointers and its rules across ranges of views and levels. When this repertoire is not available (e.g., as legend) meaning must be projected in users' aggregation. What target pointer descriptors predict depends on users' projection in resonance to domain and problem pattern. As presentation instantiates a pattern of use, the repertoire begins to afford comparison and qualification of the pointer.
Decisions for segmentation and combination of the material resource according to chosen perspectives such as material, functional or logical differentiation mediate several levels. These decisions create boundaries which often do not coincide with users' problems. For example, a presentation concerned with checking a flow system for possible leaks or blockages requires continuity and completeness of the flow topology. It does not focus on individual components, but on boundaries between components where leaks are most likely to occur. The hierarchical ATA classification does not provide such continuity: it treats components as material building blocks, not as meaningful functional units within a system (cf. appendix II–ATA-specified documents).
The material perspective comes closest to requirements of removal/installation tasks in engine built and overhaul, where component function does not matter (‘we just need to know where it is and what tools we need to take it out’). The functional perspective combines diverse components across system boundaries, or places the same component within different system contexts. The fuel-oil heat exchanger, as its name already tells, is both part of the oil system and part of the fuel system. The ATA classification does not support these different system perspectives: its structure of chapter-section-subject allocates just one place to each component.
View types on different levels of granularity combine units in different ways, which can cause problems for semantic consistency across the system.
In the cinegram, a appears between overview and component level, as exemplified by the oil pumps assembly (cf. figure 8.3). This assembly is a lump containing the Pressure pump, the Pressure filter, 7 Scavenge pumps, and 6 Chip detectors. In addition, 2 delta-P switches and 2 Pressure transmitters are mounted at the outside. The lump is so complex that no single view can display the functionality of all the components. Also, some component subsets cannot be separated since only a confluent presentation makes sense of individual components. A pressure relief valve, for example, only makes sense in combination with the pump upstream that it is supposed to relieve and the filter downstream that causes the pressure rise as it gets blocked.
(a) (b)
Figure 8.3. View (a) shows a line drawing of the oil pumps assembly. It contains the Pressure pump, the Pressure filter (the large cylinder at the bottom), 7 Scavenge pumps, and ports for 6 Chip detectors (facing downwards). The two delta-P switches and 2 Pressure transmitters are not shown; they would be mounted on the flat faces at the top. Neither the outside view nor any single cross section (b) can give an impression of the component functionality.
The optimisation of boundaries on different levels of architecture can lead to granularity conflicts at their mutual boundary. Optimisation on the overview level separates functionally distinct components (cf. figure 8.4 a) while optimisation on the component level lumps the same components together.
Other boundary problems appear when functional system overviews include components covered in different ATA chapters. The cooling system, for example, sits oddly between two ATA chapters covering oil and fuel system (cf. figure 8.4 b).
(a) (b)
Figure 8.4. In view (a), the shaded area indicate the components which are all contained in the pumps and filter housing assembly; view (b) shows the oil system components which have part in the cooling subsystem (two fuel temperature sensors and the Engine electronic control are also involved and are not shown here).
The boundary conflict appears at the point of transition between the two levels. For example, selecting the pressure filter icon on the overview diagram leads to a component view based on a which shows not only the pressure filter, but also the pressure pump and the Pressure filter delta-P switch (cf. figure 7 in appendix I–Cinegram).
Cueing has been described in chapter 5–Articulation as one aspect of resource transformation. Designed cues increase visibility of some parts of the display over others. For example, mandatory memos have a red stripe at the top to distinguish them from other documents. Cueing may be operational or semantic.
Operational cueing differentiates between distinct units or views. It differentiates between views by securing that they look sufficiently different [38] to be noticed in navigation. It aims to ensure that some units are noticed as content and others as pointer tokens [39]. For this end cueing employs conventional metaphors or imitates material affordances, as in the push-button look of on-line pointers.
Semantic cueing makes salience decisions. The general design problem of predicting needs also appears in the selection of ‘relevant’ things or processes to be rendered salient. While users articulating cues can be sure of relevance since cueing is occasioned by their problem, designed cues are secondary articulations of salience that affordand, by implication, preclude particular understandings by attributing values according to predicted problems and acts of navigation. Trail functions and bookmarks in on-line document systems assume that users want to go back to views seen earlier. Rolls Royce's Highlight Communication, a weekly internal newsletter, is semantic cueing that assumes the relevance of what it selects to be ‘currently going on’ in the organisation.
Layout is the visibility of architecture. In an on-line system where everything appears on the same limited screen , the material substrate does not implicitly enforce a layout beyond the view boundary. In paper-based systems the substrate [40] contains subtle cues that facilitate orientation, such as the thickness of a document transparently felt during browsing. The lack of such tactile continuity in on-line documents creates usability problems [41]. Printed documents support basic problems such as finding the midpoint (here: the contents page) through its conventional placement near the front or back. The cinegram evaluation has shown that the equivalent problem of going back to the overview can lead to presentation breakdown after just one step, even if the interface offers 4 redundant options for backtracking (via the main menu, pop-up menu, ‘go back’ button and ‘overview’ button).
Another layout advantage of printed documents is that the real estate of the view can be extended; for example, different documents can be spread out on the desk and rearranged at will to reflect a situated problem pattern. In on-line documents, navigation distance may not correlate with distance in the conceptual architecture: for example, links between adjacent components may transparently cross ATA chapter boundaries.
In an on-line architecture the optimal layout of nodes for direct access is a shallow tree structure. This means fitting all component pointers onto one overviewwhich creates a navigation distance of one step from the overview and of never more than two steps from any one component to any other component. This imposes a limit on the number of units that can be displayed simultaneously. If too many are displayed, the visual search time will increase and render the advantages of a shallow structure obsolete. How many tokens are still acceptable cannot be meaningfully determined without taking into account gestalt features, i.e., the way tokens in the overview are organised by clustering, grid arrangements, or linking.
In printed documents, navigational control is immediate (e.g., through fingers stuck in two places of a manual). In on-line documents, the multiplicity of views [42] without tangible substrate implies ceding control to the system and coping with the unpredictability this implies [43].
Since its target is invisible, the pointer must appeal to the construction of an identity relation which makes navigation predictable. A pointer in an on-line document may trigger very different activities. For example, it may switch to another view, change the state of the current view (stop or start an animation, zoom in or out, reveal cut-aways), or delegate some activity the system. The uniformity of the view real estate in on-line systems introduces the difficulty of differentiating between persistent object and changing attribute or status. What is technically a change of object, e.g. a different node in the system, may be perceived as a change of status, e.g. the on/off states of a pump. Is a similar icon in the same place on another view the same token with different status, or another object? At what degree of difference does change of attribute flip over to change of object?
Design attempts to indicate options for navigation through pointer differentiation. This differentiation is mediated over all levels of system up to the domain perspective. The repertoires and rules for differentiation have a logical innocence which is unaware of the mess of the referent system. While the behaviour of individual referent objects such as their degree of freedom or their function in the system context implies very different pointer affordances, the architecture suggests constraining pointers to a few consistent types. In the cinegram design, this problem appeared in the difficulty of allocating consistent behaviour to the transparent pointers superimposed on animated component views. The pump rotates or is static, which indicates the on/off mode as appropriate dimension and places the pump in the context of system operation. But a similar mode toggling between states would show the filter being blocked and unblocked, or removed and installed, placing the filter in the domain of troubleshooting or line maintenance respectively.
In the following, the term ‘schedule design’ refers to the design of scheduled documentsfor short, schedulesthat purposefully combine, order and possibly pace a range of views, often in correspondence to some predicted order of events in the referent domain. The schedule refers to some higher order meaning, such as the meaning of a procedure, history or argument. For example, Service Engineers have suggested that it would be useful to show the history of equipment as a schedule of schematics of different modification standards (cf. appendix IV–Brainstorming summary).
Schedule design is an act of transformation that goes beyond mere combination of content dimensions (cf. sub-section 5.2.3 Form and combination in §5–Articulation). Schedules time content as development and accumulation of meaning. They show temporal, conceptual and causal adjacency of events as an accumulating process where earlier events affect later events, while these project (or ‘retroject’) new accumulated meaning onto earlier events. Through their ordering and pacing of content, schedules assume an agency which can be in conflict with the agency of users' emergent presentation.
The agency of schedules is implied in properties of their material substrate. Designing these properties defines the schedule's agency and thereby predicts users' likely needs. An agency conflict between schedule and user arises when users' response presentation produces needs that call for navigation beyond the content offered in the schedule. Such needs are largely unpredictable since they are contingent on many unpredictable factors such as resonant experience, confluence of other resources, and particularities of the problem and the situation in the setting. Response presentation also produces emergent understandings that may saturate the problem prematurely and thereby suspend attention to the schedule.
The most important material properties determining the schedule's agency are accumulative order, visibility and pace.
The accumulative order of content predicts the relevance of the schedule for a particular type of use. For example, a manual procedure predicts an accumulative equipment installation process, while a training lesson predicts a meaningful conceptual order in the explanation of system functionality. However, the order of users' presentation requirements can only be predicted for domains with very regular patterns of activity. Even in strongly regulated domains such as aircraft maintenance, a schedule of tasks may be re-ordered and later signed off on the job card in one batch when this is more convenient in the given situation or helps avoid conflicts with other concurrent maintenance activities.
Interactive schedules can supplement the accumulative order with options for emergent navigation. For this end the schedule may provide timed pointers to hidden content, i.e., buttons available only for the duration of a particular segment. Designing these options for navigation which suspend the agency of the schedule introduces a further dimension of prediction. The transition to another view may express different kinds of relations which design must differentiate. A pointer may cause temporal or causal state changes; rendering changes, e.g., zooming in and out; or spatial changes, such as switching to adjacent components.
Given appropriate topic segmentation, a further option of interactive schedules is to allow the adaptation of topic order, for example, by offering different schedule modes with different segment combinations (e.g., overview mode, expert mode, or beginners' mode).
The visibility of content is timed by the schedule, not a result of users' navigation. Usually, only one view of the schedulereferring to one instance or step in the referent processis visible at any time.
Timed visibility means that the complete schedule as a semantic unit is accumulated topic by topic. A problem for schedule design is that topic accumulation predicts the continuity of users' confluent response presentation. As the schedule proceeds, it assumes that users will build up an increasingly rich problem pattern which will remain consonant to the chosen levelling of topic. This prediction includes the point of entry, display order, and continued attention until topic close-out. But not even the non-interactive schedule (e.g., a video tape) can determine the continuity of users' response presentation, such as the temporal boundaries of their window of attention or the likelihood of interruption and distraction through concurrent but unrelated events in the setting.
In interactive schedules, uninterrupted viewing of the schedule from beginning to end is even less likely since emergent navigation can override the schedule's agency. In the cinegram, many users chose to navigate to individual segments rather than viewing the schedule as a whole. The unpredictability of accumulation creates problems for segmentation to which I will return at the end of this section.
Pace is a property of timed schedules only, such as training lessons, video, or animation. The pace times the schedule's display of content and thereby predicts temporal tolerances for users' response presentation. In other words, it predicts the time users will need to make sense of the schedule. The schedule navigates and thereby potentially hinders emergent presentation, particularly if timed pointers disappear exactly at the time when users want to navigate. The choice of pace embodies predictions as to users' expected literacy, background knowledge, level of argument, and setting conditions. Since the schedule is designed for an average user profile rather than for a particular subject, the pace will be an average value which will bore some users and ask too much of others.
Interactive schedules afford the interruptability and reversibility of pace to allow for emergent repair. They also allow changes of pace.
One technique for the implementation of a paced schedule into on-line document systems [44] is animation [45]. It has been used extensively in the cinegram prototype (cf. appendix I–Cinegram). Animation schedules a range of individual views and paces their display. The technical primitive of animation is a schedule containing just two different views [46].
Animated views have advantages over static views [47]. In the cinegram, they afford the immediate pick-up of a range of referent system dimensions which must be symbolically coded in static displays. For example, they show the direction and speed of fluid flow, differentiate the boundary between static and moving parts, and show constraints and interactions across parts during system processes.
The design the cinegram prototype retains the benefits of animated views and at the same time attempts to mitigate the problems related to the agency conflict. The solution has several aspects:
(1) First of all, schedules are segmented according to conceptual units. This provides more points of entry and reduces the schedule's agency to the current segment (cf. section Steady-state animation in appendix I–Cinegram). Segment looping turns the schedule's agency into a qualitative dimension of content. In other words, the segment assumes a secondary staticity with a local temporal dimension. For example, a segment may simply show the rotation of a pump and the direction of oil flow as a closed loop. In other cases the segment may keep repeating a small part of a larger process so as to enable the user to get familiar with all aspects before moving on to the next conceptual segment. Here, the segment length must remain within the temporal tolerances to be expected in the domain, which will be wider in educational settings and narrower in professional settings, particularly under conditions of response pressure. Loops showing parts of processes with obvious cut-off points indicate that the segment is part of a larger schedule and afford predictions of temporally adjacent segments.
(2) Segmentation has the additional benefit of allowing the process to be rendered conceptually, particularly where processes are short or complex and therefore warrant repetition, or where the temporal proximity of co-variant but causally unrelated events could suggest unwanted confluence (cf. section 7.1.1 Projection and confluence in chapter 7–Confluence).
(3) Segments are cued by descriptors which are lined up in a schedule control panel. This affords both emergent navigation to other segments and paced navigation by the schedule's code. The panel also contextualises the currently visible segment through markers or highlighting.
(4) Segmentation can optimise the local context for stand-alone display of segments. However, there is a trade-off between optimising segments for viewing within schedules and stand-alone display.
The cinegram design has highlighted problems which are likely to appear in all node-based systems that include time-based media. I single out two aspects which seem central: the schedule interface and segmentation.
The schedule interface presents the temporally extended schedule as a spatial extension. While a slide bar with a moving ‘thumb’ in digital video formats such as QuickTime assumes the integrity and unity of the schedule, the cinegram's schedule control panel breaks the schedule down into distinct conceptual segments. This makes the schedule navigable, but it also introduces a secondary temporal architecture alongside the spatial architecture expressed in common navigation panels. The crucial point is that in the cinegram, schedules are not an add-on like bits of digital video which are tied to a particular node; instead, schedules time and navigate segments which also exist as static (or looping) nodes of the spatial architecture.
Toggling between spatial and navigation poses the design problem of negotiating context at their boundary. When entering schedule navigation, should context default to the point of suspension of spatial navigation so that any scheduled transition to other states or locations is forgotten when users resume spatial navigation? Or should the last node called up by the schedule ‘carry over’ to become the new spatial midpoint defining the local system context? The problem extends to temporal and state changes produced through scheduled agency, which may be reversed or carried over to emergent control. The opposite problem appears when users suspend a schedule to navigate themselves. Should they return to the schedule where they left it, or should the interface offer all schedules that are locally available at the new location? One possibility is to prompt users to select if they want to return to the respective point of suspension or remain where they are. What solution is chosen in any particular case will depend on the characteristics of the domain and the nature of content.
A second problem for schedule design is segmentation. One can distinguish three problem areas: granularity, temporal scope of segments and distortion.
The segmentation of the schedule defines the conceptual and technical granularity of its content: segments are both individual conceptual units and technically, addressable nodes listed in the schedule control panel. The cinegram schedule design has shown that the optimal technical granularity for a recombination of segments maximising re-use across schedules does not map easily onto a conceptually useful granularity. For example, there was a need for short transient segments that link different static views or looping segmentssay, the pump in static mode, working mode, and empty mode (caused by a filter replacement). But these transient segments have no meaning other than providing a continuous visual transitionin other words, they have no meaning as stand-alone views within the spatial architecture. Like all other animation in the cinegram, transient segments are called up on entering nodes invoked by the schedule. When they are accessed through emergent navigation, they interfere with users' agency since they automatically navigate to their target node. This has caused irritation with some cinegram users, particularly when using slow hardware where such transition is less immediate than it should be.
In contrast, a conceptually guided segmentation might suggest the splitting of a segment showing two confluent and co-variant events in order to avoid projection of a causal link (cf. subsection 7.1.1 Projection and confluence in chapter 7–Confluence).
Segmentation also defines the temporal scope of individual segments, and thereby, thetake-up point of the process that frames its conceptual event. A design problem related to segmentation appears when segments are both discrete locations for navigation and constituents of the schedule. Designing the whole schedule as an accumulating process must be squared with decisions as to the temporal scope of each addressable segment. The stand-alone segment requires more event (especially more ‘pre-text’) which would otherwise be provided by the schedule.
Many events receive meaning from their position within the overall process. Understanding the movement of a spool valve, for example, requires backtracking to the source of the fuel input that causes the valve's movement. A boundary decision must be made about the take-up point of the process preceding the event. The need to show process periphery in order to make sense of its constituent events creates a problem for the overall schedule, since segments providing generous temporal scope do not link up as they are concatenated as schedule: they overlap. If the take-up point is kept constant for segments constituting a particular process, this can be understood as cumulative explanation. However, this involves much duplication so that the schedule may be too slow for the temporal tolerances of the setting.
Finally, segmentation distorts the continuity of referent processes. It interrupts the flow of animation, which helps conceptualisation but may at the same time disrupt the understanding of gradual processes. Users are forced to decide if halts in the schedule are aspects of the displayed content or motivated by its conceptual or operational rendering. Equally, segment looping may be motivated by content semantics or conceptual semantics. It may show a smooth steady state cycle, or merely repeat one part of a transient process in order to provide time for response presentation.
The temporal distortion introduced through segmentation means that users must re-compose and compress segments in their response presentation in order to understand the schedule as a whole. As one professional engineer put it: ‘You just have to mess with time to show how it works’ [CT 4.3 P30].
[1] In his study of employee participation in systems design, Beirne (1990) has shown that the rhetoric of mutual benefit for employees and management is in fact an objectified ideology of consensual change which masks management's attempts to achieve consent for an effectiveness-oriented restructuring of production.
[2] And it often fails, as demonstrated in Ascari's et al (1995) comparative analysis of companies' experiences with BPR.
[3] In digital library research, frequency is considered as a source for ‘measures of association between documents, based on their use, that could be employed as a means of suggesting relevant documents to users.’ (Bishop et al no date)
[4] This is a cross-section of critique voiced by professional engineers. Trials with subjects without engineering training answering questions with the help of the technical manuals had shown massive usability problems. However, the validity of these trials is dubious, as one reviewing service engineer commented: ‘…it should be pointed out that in general, Service Engineers use the technical manuals frequently and successfully. Considering the amount and complexity of the material covered, it is not surprising that individuals using them for the first time and having little experience of aero-engine technology had some problems (I have problems with computer software manuals!)’ (Laffan 13/11/95)
[5] The crucial role of informal systems that develop in the interstices of formal centralised systems (Lindsay 1994, chapter 6) and permit that things get done is well recognised. Leithauser (1986, quoted in Adler & Winograd 1992 p156) argues ‘there exists an informal "hidden situation" in every organisation, largely unrecognized by external system experts.’
[6] Ottow (1996), personal communication.
[7] Other perspectives which may impact on design but are here blackboxed as businees requirement are those of industry competitors and suppliers. I also blackbox the threat of new entrants and substitutes. Cf. Porter's five forces model covered in Lindsay (1994), chapter 1.
[8] Lindsay (1994), chapter 3, also gives references to the extant literature on information economy. See also Lindsay (1995).
[9] A discussion of organisational politics in the face of decreed technological change can be found Orlikowski's (1993) grounded theory study into the adoption of CASE tools in two organisations.
[10] Operators seem rather pessimistic about cost effectiveness. One expert at Lufhansa said: ‘There are no big savings for us in moving to electronic documentation. It is only good for manufacturers.’
[11] For a description of the ATA100 specification which governs the structure and appearance of printed technical manuals, see Jones (1991). An extension to ATA100 is AMTOSS (Air maintenance task oriented support system) - see Farrington (1994). A recent application of ATA2100 for on-line documentation is Jouve Data Management's - AirGTI product line.
[12] Cf. the MIL-M-87268 (1992) specification of general content, style format and user interaction requirements of IETMS (interactive engineering technical manuals).
[13] Orlikowski (1993) found that IT department employees want to improve their portfolio through work with recent technology.
[14] Cf. Andersen & Munch (1991) or Mellish et al (1992).
[15] Cf. Carr (1994).
[16] Examples of hiding are manufacturer's deliberately obscure data formats of black boxes and the reluctance to provide the means for understanding the meaning of recorded data, or the disappearance of potentially incriminating documents, such as the ‘accidental’ overwriting of verbal data or the disappearance of incomplete stage sheets.
[17] For non-routine tasks this is particularly time-consuming. Under pressure, and with the manual in a microfiche format that does not allow the automatic compilation of the complete procedure, mechanics may generate incomplete work cards which potentially lead to subsequent maintenance errors (cf. Mellor 1995).
[18] The topical example I heard twice from workshop managers was that ‘changing a bulb in the cabin’ did not require consulting the documentation.
[19] Engineers at Rolls Royce repeatedly mentioned the danger of service engineer's habit of transferring practices learned on older equipment to new equipment where these practices were no longer appropriate. Cf. Mellor's (1995) example of mechanics' projection between the spoiler types of Boeing 757 and Airbus 320, which seems to have contributed to the incident of the A320 KMAM.
[20] Tufte (1990) demonstrates such transformation of multiple dimensions into two-dimensional views.
[21] Important decisions are rarely based on document evidence alone. Engineers even warned against displaying particular data in the cinegram (for example, distributed values for oil pressure, temperature and flow across the flight cycle) since their reliability is doubtful; they are derived from mathematical simulation models and may be misleading without expert qualification.
[22] See, for example, Olle & Hagelstein (1988).
[23] ‘I propose, that although the total number of parts depends on whim (i.e., how finely you want to partition your system is up to you), that systems are fundamentally tripartite. Requirements specification, middleware (software, firmware, lots of what is traditionally called hardware), and the truly physical bit at the bottom.’(Ladkin 1996). Ladkin argues that the requirements specification can be considered part of the design. It selects which domain parameters will be designed into the system and which will be unavailable. For example, aircraft systems do not consider the possibility that maintenance delivers aircraft with parts in a wrong state. This however is merely a design decision which could be otherwise.
[24] Participants from 25 airlines and 24 aircraft, avionics and engine manufacturers at the Electronic Document Symposium February 27 and 28, 1996 Newport Beach, California, ranked ‘Timely adoption of commercial standards’ highest as key decision driver for the introduction of electronic documentation.
[25] Lufthansa, for example, has sunk 5 million D-Mark in the attempt to engineer a system which would cope with SGML-encoded documentation from a range of suppliers, using just one DTD (document type definition) for each document type. Problems with conflicting DTDs and particularly, continuing changes to these DTDs by suppliers led to abandoning the ambitious project. The integration nightmare is now contracted out to Jepperson, USA.
[26] At this point I ignore the fact that directness is not dependent on step distance only, but also on access time which can be significant even for ‘direct’ links.
[27] For definitions of composite nodes and their media cf. Ogawa (1990), Adie (1993), Halasz (1990), or Oren (1990). Gronbaek & Trigg (1994) discuss virtual composite nodes.
[28] Cf. Duguid & Brown (1992 p167).
[29] Levy (1994 p25) distinguishes three perspectives from which documents can be viewed: ‘as artifacts, in relation to technology, and as embedded in work’.
[30] Schultz et al (1993 p196) ignore the complexity of segmentation when they say that ‘information is more accessible if you create smaller on-line chunks and topics to fit onto the screen.’
[31] In Jones' (1970/1992 p304) example, the interaction net method is used for the establishment of the spatial layout of an emergency ward.
[32] These seemingly conceptual orderings are themselves nothing but material adjacencies: the order of letters in the alphabet and the order of numbers is learned as a pattern of adjacent positions which may need to be invoked through silent or uttered murmuring to help the user remember what letter comes directly before ‘P’.
[33] A similar idea is expressed in Weiser's & Brown's (1996) notion of design that affords moving easily between periphery and centre.
[34] Cf. Suchman's (1987) discussion of garden path problems.
[35] Books offering guidelines for display design take the system as self-contained. Cf. Wagner (1988); Horton (1990); or Lewis (1988). Woods (1992) rightly criticises ‘the sophistry of guidelines…in human-computer interface design’.
[36] Cf. Wood (1992) on the power of maps.
[37] Cf. Marcus (1980). Richards (1984) offers a clear and richly illustrated taxonomy of diagrammatic expression but says little about use. Guri (1984 p52) states that ‘very little research has been conducted on the use of diagrams…’. Kieras (1992 p863) confirms this by stating that ‘unfortunately, the empirical literature on the role of diagrams in learning about systems is … very limited’. For a discussion of notationality cf. also Goodman (1967).
[38] Redundant recoding helps maximising such differences (Cf. Fitter & Green 1979, quoted after Richards 1984 pp9/2). For within-system display differentiation, cf. Bergan's (1995) principle of measurable differences.
[39] The cue is the availability of the target token amongst other tokens in the display. The common claim is that recognition is easier as recall (cf. Driscoll 1994 p94). But this sort of ease belongs to a validation context (such as tests based on questionnaires) where the matching of available target answers is sufficient for presentation close-out. The drawback of cues is that they have a priming effect (cf. Smyth et al 1994 p292). Cues type answers to an already established set, thus working against emergence of new understandings. Neatly typed contexts have little in common with more complex presentations that occur in troubleshooting. Here, documents based on typed answers, such as fault isolation charts, mainly act as scaffolding resources which ‘jog the memory’ and help ‘making sure nothing has been overlooked’.
[40] In their discussion of constraints and resources, Brown & Duguid (1992 p192) note that constraints of physical medium like the printed newspaper are often used as resources. The constraints of layout afford cues that aid detection of the assumed importance of articles, while the genre of newspaper affords the knowledge that the same article will be read by millions at roughly the same time.
[41] Laurillard (1987 p83) has described this lack of continuity in her discussion of a ‘skip’ option in an instructional VideoDisk:‘…students were very uncertain how to use this [the "skip" option]they did not know how far they were skipping, and had no way of telling how far they needed to skip.’
[42] According to Hwang and Chen (1989, quoted by Bergan (1995) in chapter 2, power plant operators complain about excessive view fragmentation. 2000-3000 variables of nuclear power plant are shown on ca. 100 views.
[43] de Young (1990 p240) talks about a temporally limited ‘transfer of control’ when navigating from one node to another.
[44] Many technical architectures for the inclusion of time-based media into interactive on-line documents have been suggested. (Cf. Ogawa 1990; Zellweger 1992; Buchanan & Zellweger 1992; Newcomb et al 1992; Little 1994; Hardman et al 1994). Which of these is chosen for implementation does not substantially affect the following argument.
[45] I am concerned with ‘canned’ animation as opposed to real-time animation (cf. Gonzalez forth. p10).
[46] There has been some discussion if the transition between two static views should already be considered animation (cf. Gonzalez forth. p6).
[47] Claims are that animation ‘makes [the] cognitive task more concrete by providing motion and trajectory attributes…’ (Rieber & Kini quoted in Harrison 1993 p45); that it can ‘demonstrate multivariate changes in form, position, and relationships over time…’ (Mayton 1990 p2); that it can utilise ‘the illusion of movement …to represent ab-stract concepts such as orthographic projection’ (Asodeeh, 1993 p9); that it allows ‘the depiction of visual messages…impossible to portray through…traditional… means’ (Belland et al quoted after Mayton 1990 p2) or that it improves attention gaining (Baecker et al 1991).